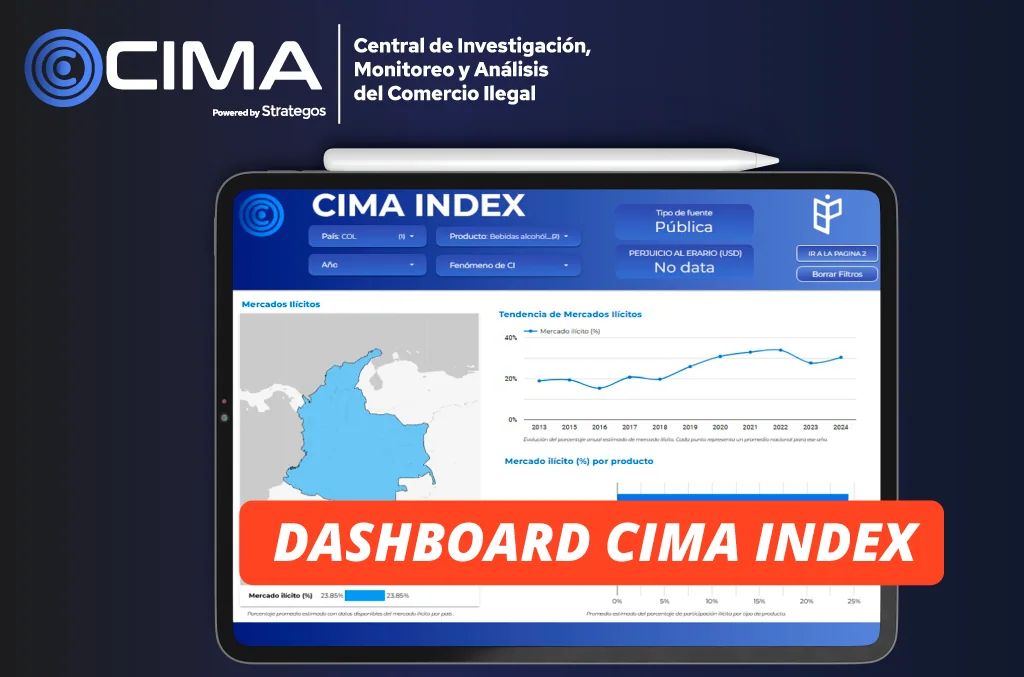
At Strategos BIP we developed the Dashboard of #CIMAindex that brings together data on the behavior of illicit markets, an interactive tool designed for organizations that need to understand how this phenomenon behaves in real time in different countries of the region.
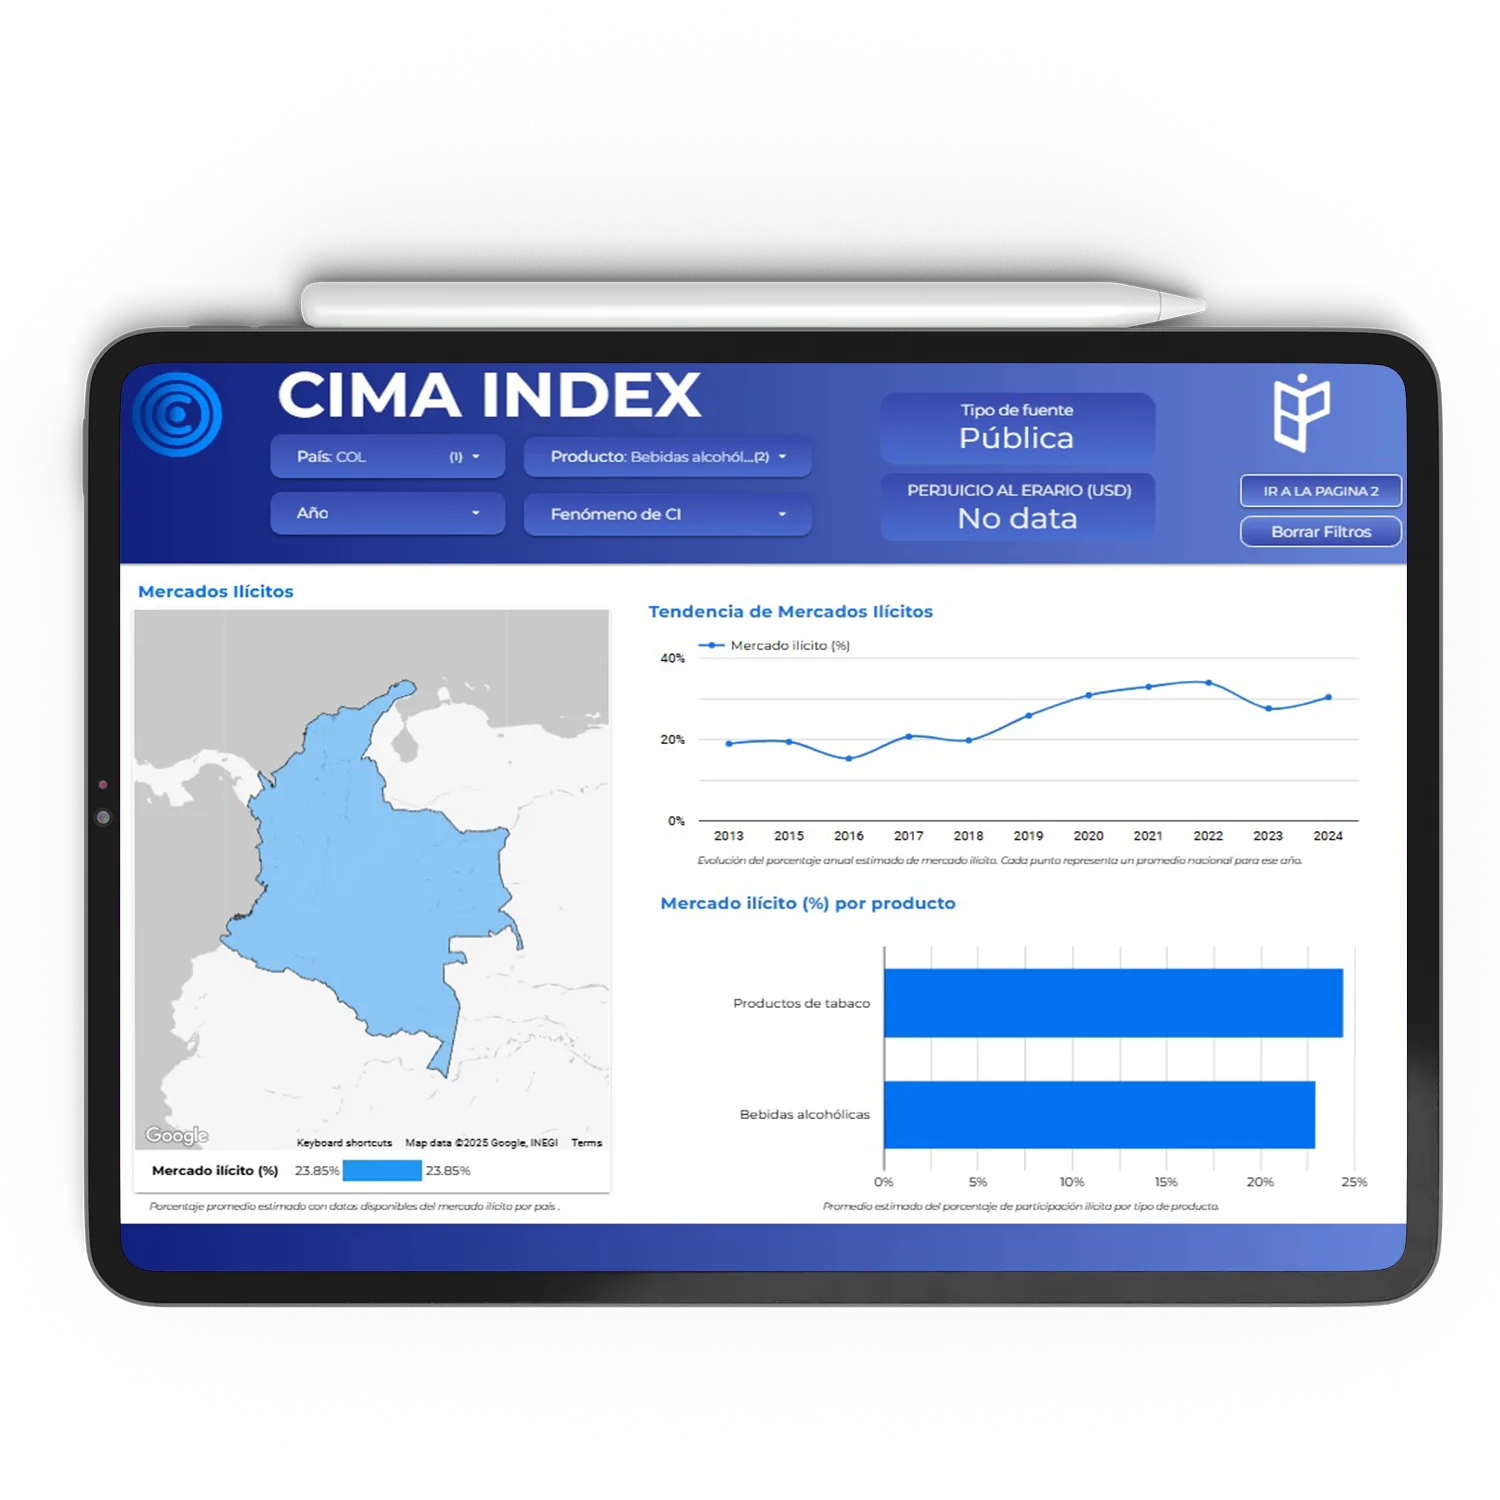
With clear visualizations, the Dashboard provides insight into:
📍 High-risk countries
📦 Most affected products
📈 Trends by year and their impact on public revenue and GDP
CIMA INDEX is useful for security teams, legal departments, business intelligence and trade associations seeking to strengthen their strategy against illegal markets.
🧠 Because data doesn't just inform: it improves decisions.
Contact us to learn more and request your DEMO!